How to "Rent" The Most Boring Stocks in Your Portfolio For Monthly Payouts of $287, $965, even $2,475 Every 30 Days
The true story of how three ordinary Americans learned to extract a second monthly income by renting out the boring blue-chip stocks they already owned.
Here are the results after testing against 8 years of data and more than 7,000 trades...
Three real 30-day cash drops on blue-chip shares.
Dear Reader,
Today, I want to share the results of an unusual experiment...
And a FREE ticker you can buy immediately to start collecting monthly yields 8-times greater than the average dividend pays today.
If you are retired, or planning to retire soon, and you want to boost your regular monthly income by as much as $2,000 to $5,000 this year—without taking on a lot of risk, and without selling a single stock you currently own— then I encourage you to pay close attention to the results of this experiment...
Because I'm going to show you exactly how to use what we found to begin earning an immediate cash injection into your retirement account the next time the market opens.
And based on what I'm seeing in the world today...
This may be the single most important letter you read this year.
Right now, the S&P 500 dividend yield is hovering around 1.07 percent.
That is the lowest dividend yield the index has paid since the 1800s.
Lower than during the Great Depression.
The traditional retirement system people relied on for fifty years is dead.
On a standard $383,000 retirement account, a 1.07 percent dividend yield produces about $340 a month.
You can barely cover a week's groceries and a utility bill with that.
What 1.07% Actually Pays a Retiree
On a standard $383,000 retirement account
Lowest S&P 500 dividend yield since the 1800s — lower than the Great Depression.
As a result, I'm watching people who spent 40 years building a conservative nest egg—people who threw the retirement party and packed up their desks—suddenly find themselves putting on a new uniform to stock shelves or drive for Uber just to survive inflation.
And they aren't outliers.
According to a Harvard study published in the Journal of Human Resources, within six years of retirement, up to 40% of retirees end up back in the workforce.
The Bureau of Labor Statistics projects that nearly 1 in 3 Americans aged 65 to 74 will be in the workforce this year—nearly DOUBLE the rate from 1996.
And the U.S. Bank 2025 Wealth Report puts the dread in plain numbers: nearly two-thirds of all Americans now worry they will eventually have to re-enter the workforce after retiring.
The Retirement System Has Already Broken
of retirees end up back at work within 6 years
Harvard / Journal of Human Resources
Americans aged 65–74 in the workforce this year
Bureau of Labor Statistics
Americans worry they'll have to un-retire
U.S. Bank 2025 Wealth Report
The traditional retirement system has failed.
But, there is a solution.
A solution I discovered during my time managing money inside the velvet rope on Wall Street.
I watched the wealth management divisions of the top 10 banks in the world extract tens of billions of dollars in upfront cash from the exact same Apple, Microsoft, and McDonald's stocks the rest of America holds.
They didn't sell the shares.
They didn't wait around for the 1.07% dividends.
They used an obscure financial mechanism to essentially rent them out.
For example...
If you held 100 shares of McDonald's recently, you could have logged into your account, triggered this mechanism, and collected an instant $282.
You could have done the same with 100 shares of Johnson & Johnson and snapped up $287.
How about Apple?
Apple pays a pathetic 0.37% dividend.
But renting out 100 shares of Apple for just 30 days recently paid $296.
That is three times Apple's full year of dividends, deposited into your account in a single month.
And on Meta?
100 shares triggered a cash drop of $2,475.
That's enough to cover the average mortgage in America right now.
What 100 Shares of Each Blue Chip Recently Paid in a Single 30-Day Window
| Stock | Shares | 30-Day Payout |
|---|---|---|
McDonald's MCD | 100 | $282 |
Johnson & Johnson JNJ | 100 | $287 |
Apple AAPL | 100 | $296 |
Meta META | 100 | $2,475 |
Cash deposited into your brokerage account. Shares retained.
And the thing to remember is this money is yours to keep.
Nobody can take it from you, claim it, or make you pay it back.
Furthermore, you keep every single share of the stock you started with.
Currently, JPMorgan is using this exact secret on $78 billion of their wealthiest clients' money.
Morgan Stanley is doing it on more than $400 billion.
Where the Smart Money Is Already Parked
$478 billion+ in institutional capital — running this exact mechanism on the same blue chips you hold.
But before I show you exactly what's going on, you should know who I am... and why I've managed to get so close to this safeguarded, and highly profitable Wall Street income secret.
My name is Dylan Jovine.

I didn't grow up with a silver spoon. I didn't inherit a trust fund. I grew up standing in line for food stamps in Queens, New York.
Like any dirt-poor kid desperate to change his fortune, I set my sights on the one place where the money actually moved: Wall Street.
And like every "nobody" trying to make it on The Street, I was laughed out of every Ivy League-filled room I walked into.
But one man took a chance on me. He took a chance because he'd been an outsider himself, before saving New York City from bankruptcy in the 1970s and growing his own reputable firm. His name was Peter Jacquith.
I learned everything I could. I stayed later, read deeper, and worked twice as hard as the guys with the diplomas.
By the age of 24, I had built my own firm at 100 Wall Street.
I became one of the youngest broker-dealers in American history.
Before I was 30 years old, more than $1 billion had passed through my hands.
I spent my entire thirty-year career reading the boring, dense, hundreds-of-pages-long regulatory documents that Wall Street analysts are too lazy to open.
That method is how I saw the 2008 financial crisis coming before anyone else.
Leading up to the market peak, I pulled the mortgage-backed security documentation. I saw the rot in the numbers.
I issued a public warning that the housing market was a ticking time bomb.
When the S&P 500 dropped 57% after my warning, my readers were protected. And when the dust settled, I went on CNBC in March 2009.
The Dow was at 6,500.
There was blood in the streets.
I called the absolute bottom.
The market bottomed within days. Anyone who heeded my call had the chance to book gains on my recommendations, like 459% on AutoNation... 646% on American Express... and 700% on Starbucks.
March 2009: The Bottom Call That Delivered Three Triple-Digit Winners
Recommendations made after Dylan called the absolute bottom on CNBC, March 2009.
| Stock | Gain |
|---|---|
AutoNation AN | 0% |
American Express AXP | 0% |
Starbucks SBUX | 0% |
$5,000 invested in each call — $15,000 total — would have grown to $107,250.
Average gain: 601.7%
I did it again in March 2020. While the world was locking down and the crowd was panic-selling, I called the bottom almost to the exact day.
FACT: When we get to the other side of this, the market will have a “SNAP-BACK” rally because prices and interest rates are so cheap.
In 2021, I told my readers to buy an unknown data company called Palantir at just $7.38 a share. It skyrocketed 2,450%. I found Axon Enterprise at $28 a share. It shot up over 3,000%.
Two Calls Most Analysts Were Too Lazy to Find
Palantir entry: $7.38 (2021) · Axon entry: $28
$5,000 in each at entry → $122,500 + $150,000 = $272,500 total
Across my entire career, analyzing eight years of closed positions at my independent research firm, my method has maintained a 75.2% win rate.
Three out of every four calls, correct. For nearly a decade. With an average return of 35.9% across every single trade.
Dylan Jovine's 8-Year Track Record
3 out of every 4 calls correct
Per trade across closed positions
Across 8 years of closed positions at Behind the Markets.
I am sharing this track record with you not to brag, but to because I want you to understand one fact: I don't guess. I follow the money.
And all of that has led me to this – a mechanism that allows you to take stocks in your portfolio, right now, and "rent" them out to investors every single month... and collect payments from some of the most commonly held stocks on the market.
I'm talking about being able to "rent" out 100 shares of McDonalds and collecting $560 in a month... while the stock itself is down 10%.
Or "renting" out 100 shares of NVIDIA during one of the most volatile periods of 2024... and grabbing an instant payout of $965.
Even "renting" out 100 shares of Google while they were dealing with the single biggest antitrust ruling against a major tech company in 20 years.
Even through that, you could have collected an instant $400.
Imagine collecting $400 on Google one month... $560 on McDonald's the next... $965 on NVIDIA the month after that. That's nearly $2,000 in cash deposited into your retirement account in just 90 days — from blue-chip stocks you may already own.
Cash Drops on Three Blue Chips — Under the Worst Conditions
Cash collected regardless of what the underlying stock did.
| Stock | 30-Day Cash Payout |
|---|---|
McDonald's MCD Stock down 10% | $560 |
NVIDIA NVDA Volatile 2024 period | $965 |
Google GOOGL Largest antitrust ruling against Big Tech in 20 years | $400 |
During each of these situations, regular investors had to just deal with whatever the market threw their way – but folks who understood this "renting" strategy had the chance to stack up 4-figure profits every 30 days.
In some cases, even 5 figures – you'll see how shortly.
This strategy works so well that JPMorgan was forced to build a public version of it themselves—a single ticker symbol that any American with a brokerage account can buy this afternoon.
They had to. The institutional demand was so massive, ordinary investors who could not afford their multi-million-dollar private wealth minimums were demanding access.
The fund pays out roughly 800% more than the average S&P 500 dividend stock.
More than DOUBLE what the best 1-year CD pays.
And before this letter is over, I am going to give you that ticker symbol—completely free.
No membership required. No advisor fees. You can buy it in your brokerage account in 60 seconds.
It is the free gift I'll be sharing with you before the end of this message.
But first, I want to show you why even that public version is only HALF the prize.
Because what JPMorgan is forced to give the public is a watered-down version of what we tested in our experiment.
Typically, to access the full power of this kind of income, you'd have to hand a million-dollar minimum over to a private wealth manager and pay exorbitant fees.
Or, you'd have to take on reckless risks in the markets like a gambler at a craps table.
But that's not the case here.
In this case, you can generate more money with less risk thanks to a principle of greater knowledge and control.
There's a very specific reason you've likely never heard of this idea before.
It's because regulators wrote aggressive compliance rules decades ago legally restricting mass-market retail brokers.
If they call you on the phone and tell you how to do this, they risk massive fines and losing their licenses.
So the insiders keep the secret, and they keep the cash.
But a few years ago, I decided to test this strategy to see if everyday Americans could bypass the red tape and use this exact same Wall Street machine from their own standard brokerage accounts.
Paper trading wasn't going to cut it.
I wanted to see if everyday Americans—without millions of dollars and without Ivy League finance degrees—could use this exact mechanism to safely pull a second income out of their own standard brokerage accounts.
The Ultimate Real Life Test
So, we decided to do the research... and find exactly what kind of results regular Americans can see when they "rent out" their stocks.
Let me introduce you to three of the people who proved that this Wall Street machine can be operated by anyone, from anywhere.
Case Study #1: The Former History Teacher
The first person I want to introduce you to is the man who actually runs the quantitative research behind this strategy at my firm today.
When I met him, he had absolutely no Wall Street pedigree. He was not a quant. He didn't have a background in high finance.
He was a former high school history teacher.
He spent years teaching civics and general studies in what district administrators politely called a "lower economic" school—the kind of district where one hundred students were forced to share twenty textbooks because the school couldn't afford more.
On a tight teacher's salary, he was struggling to keep his head above water.
The traditional retirement advice—buy mutual funds and wait 40 years— was a dead end for him.
So, on his own kitchen table, after grading papers, he started studying the financial markets.
He stumbled upon the mechanics of how large institutional funds were generating extra income by renting out their blue-chip stocks.
He realized he could execute the exact same strategy on the small number of ordinary shares he had saved up in his own standard brokerage account.
He didn't take reckless risks.
He didn't gamble on penny stocks.
He learned to rent his shares out every 30 days, like clockwork.
The open market began wiring cash directly into his account.
He used that cash to pay the electric bill.
He used it to pay the rent, and then a mortgage.
He kept the lights on at home using the exact same mechanism JPMorgan runs on $78 billion of institutional capital.
Same mechanism. Different account size. Same monthly cash drops.
He became so obsessed with the safety and reliability of this protocol that he eventually left teaching.
Which is why I asked him to run the most aggressive and challenging research project in our firm's history.
I gave him all 87 stocks I've recommended at Behind the Markets over the last 8 years.
What he found blew me away.
To avoid data dilution, he removed our 15 best performing stocks...
Like Axon Enterprises, which has jumped 3,000% since my first buy alert..
And RocketLabs, which has surged 2,500%.
Or Palantir, which exploded 2,450% from my buy recommendation when it was sitting below $8.
With all these high-flyers out...
Something amazing emerged out of more than 7,000 trades he reviewed and measured...
He found that "renting" the other, low performing stocks out over that 8 year period would have resulted in 475% more growth than if you had simply bought and held those stocks over the same period of time.
more growth than buy-and-hold
7,000+ trades · 72 stocks (top 15 winners excluded to avoid dilution)
Imagine taking your slowest moving, least exciting stock right now...
Or a stock that just keeps disappointing you...
And increasing your profit 475%.
Let me show you what that actually looks like at the level of a single position — applied to one of the most heavily owned blue-chip stocks in retirement accounts in America today.
Microsoft.
If you had bought 100 shares of Microsoft in April of 2024 — at $415 a share — and held that position through April of 2026, the stock itself would have returned just $779 in capital appreciation.
Less than 1% per year. On a $41,500 position. On the most widely held tech stock in America.
That is what buy-and-hold delivered.
Now here is what happened during those exact same two years when our research team applied this rental protocol to those same 100 shares.
In May of 2024, during a period of steady market tape — no panic, no news, just an ordinary month — the strategy collected $580 in cash on those Microsoft shares.
In October of 2024, with Microsoft heading into its Q1 earnings report and amateur speculators bidding up call options trying to bet on the announcement, the strategy collected $895 in cash on those same 100 shares.
In April of 2025, during the peak of the tariff crisis — when the financial press was screaming about a market collapse — the strategy collected $1,360 in cash on those same 100 shares.
And in April of 2026, just a few weeks ago, with the market back to a steady tape, the strategy collected another $860 in cash on those same shares.
Total cash collected: $3,695.
In just four months across the 24-month window. On Microsoft. The stock that barely moved.
Now here is the part that matters.
That $3,695 in cash was not earned in place of the stock's appreciation.
It was earned ON TOP of it.
The retiree who rented his or her shares of Microsoft kept every dollar of the stock's $779 appreciation.
And collected $3,695 in additional cash on top — money deposited directly into the brokerage account, immediately spendable, no shares sold.
Total return for the buy-and-hold investor: $779.
Total return for the retiree who applied the rental protocol: $4,474.
Almost six times the total return. From the same shares. In the same window. On a stock that was essentially flat.
Same shares, same window — 5.7× the return
This is what 475% more growth looks like when you bring it down to the level of a single retirement-account position.
Because the cash from renting your shares does not replace what the stock does.
It stacks on top.
If a former history teacher can execute this strategy on his kitchen table to multiply the returns of a basic portfolio by six times, do you think you could do it too?
Case Study #2: The Conservative Retiree
Now, it's one thing for a younger guy like our quant to learn a new financial skill.
But what about someone who has already crossed the finish line? What about a conservative retiree who is living on a fixed income and is terrified of losing their principal?
Take the case of Bob.
Bob is a retired school administrator. He did everything the financial textbooks tell you to do. Over a lifetime of hard work, he built up a $300,000 portfolio consisting of conservative, dividend-paying blue-chip stocks. The kind of portfolio every retirement guidebook tells you to build.
One of his largest holdings is 100 shares of Verizon.
It is one of the most boring, defensive, widely-held dividend stocks in America.
Verizon pays him a regular corporate dividend of $266 per year.
When you break that down, it comes out to about $22 a month.
Bob was supposed to fund his golden years with that? $22 a month is barely enough to cover a single cell phone bill. It is mathematically impossible to survive inflation, property taxes, and rising healthcare costs on a 1.07% S&P yield.
So we ran the experiment on Bob's Verizon position.
He didn't sell his Verizon stock. He didn't buy anything risky.
He simply logged into his brokerage account and listed his 100 shares of Verizon for rent.
Now, Bob is collecting double or triple every 30 days what he used to wait three months to receive.
Same shares — 6× to 9× the monthly income
Bob isn't doing anything fancy.
He's not picking exotic stocks.
He's renting out the same boring blue-chip shares millions of retirees already own—and pulling in an income stream that dwarfs what the CEO of Verizon is sending him on the dividend check.
Case Study #3: The Son and the Aging Mother
But the most urgent result from our entire experiment involves the darkest fear hanging over the Peak 65 generation right now...
The chunk of the population is staring at a future where they spend their Golden Years delivering DoorDash orders or stocking Wal-Mart shelves to make ends meet.
I want you to understand exactly what is coming.
According to the latest Social Security Trustees Report, the Social Security retirement trust fund will hit zero in 2033.
Six years and seven months from today.
When it runs out, federal law mandates an automatic 23% benefit cut for every single American collecting Social Security.
That cut hits 70 million Americans simultaneously.
The median retiree loses approximately $18,000 in annual benefits—overnight, by force of law.
And the people getting hit are not prepared.
Charles Schwab's most recent retirement industry data shows the average American approaching retirement has $383,000 saved.
Larry Fink—the chairman and CEO of BlackRock, which manages over $14 trillion in retirement assets—was so alarmed by what he was seeing in his own client data that he wrote it into his 2025 annual shareholders letter.
He surveyed 1,000 Americans and asked them what they would actually need to retire comfortably.
The average answer was $2.1 million.
In Fink's own words: "That's a lot. More than I was expecting. And almost no one is close."
The gap between what Americans have ($383,000) and what they need ($2.1 million) is one million, seven hundred and seventeen thousand dollars per retiree.
That gap is mathematically uncloseable through traditional savings and dividends.
The only way to close it is to make your existing portfolio work several times harder than it currently does.
What Americans have vs. what they need
Which brings me to the third member of our experiment.
A subscriber wrote to me about his mother—she was attempting to survive on a small California pension, a modest Social Security check, and a tiny nest egg.
Every time she went to the grocery store, inflation had eaten away a little more of her purchasing power. Her standard of living was slowly collapsing.
Her son knew that if he didn't intervene, she would eventually run out of money.
She couldn't rely on the 4% rule.
She couldn't rely on 1% dividends.
So he showed her how to rent her stocks.
Apple is one of the most widely held retirement stocks in America. The mother held conservative blue-chip shares like Apple in her account.
Apple pays a pathetic 0.37% dividend. That's roughly $100 for the entire year on a 100-share position. About $8 a month.
But conservative blue-chip shares like Apple, rented out for 30 days, can trigger cash distributions running into the hundreds of dollars per month—several times higher than the annual dividend.
In our verified backtest, 100 shares of Apple rented out in a recent 30-day window produced a $296 cash distribution.
Three times Apple's full year of dividends. In a single month.
3× the cash — in 1/12th the time
That's the kind of cash her son taught her how to extract.
Her Social Security check stopped being the ceiling on her standard of living.
She is generating her own cash, on her own terms.
These three individuals are not Wall Street insiders.
They are not hedge fund managers.
They are a former history teacher... a retired school administrator... a son taking care of an aging mother.
Ordinary Americans who learned the same secret the federal regulators don't want you to know.
They are pulling cash out of the same blue-chip stocks JPMorgan, Morgan Stanley, and Gateway are renting on the inside of the rope.
And the best part is, they are doing it with an astonishing level of safety.
The people I've mentioned are far from the only ones using this strategy. Across the country, ordinary Americans are collecting payments week after week, month after month.
One man, named John A., has written publicly that he generates "a solid $3,000 to $5,000 per month" renting his portfolio.
Lester P. documented generating "$800 to $1,000 of premium per week" renting his SPY position.
And the retired author named Albert D. reports that renting his shares "generates roughly two to twelve times the dividend income" his stocks paid on their own.
Three Real Renters. Three Documented Results.
“$3,000 to $5,000 per month renting his portfolio.”
“$800 to $1,000 of premium per week renting his SPY position.”
“Two to twelve times the dividend income.”
Stop and let those numbers sink in. $3,000 a month is $36,000 a year — more than the average Social Security check. $800 a week is over $40,000 a year. Two to twelve times your dividend income. These are real people, doing this every 30 days, on stocks they already own.
But exactly how were they doing it?
The Beach House Protocol
I'm going to tell you exactly what this is—the same way I explained it to my 80-year-old mother, who I now use this exact strategy to cover the bills for.
You see, the strategy to "rent" your portfolio is a specific trade executed through the options market.
Now, most people hear the word options and think of big, speculative swings in all-or-nothing bets to catch triple or quadruple digit gains.
"Those things are reckless gambling," people tell me. "Everybody knows that."
"You are absolutely right," I always answer. "80% right."
That usually stops them.
"What do you mean... 80% right?"
Options are not like regular stocks.
Someone is always buying a bet... and someone is selling the bet.
Traders use them the way most gamblers use the craps table.
They take big risks on the chance of getting big rewards.
They bet on a stock tripling overnight.
And much like the odds in a casino, a Chicago Mercantile Exchange study has shown that over a three-year period, investors who used options to try and bag big gains lost, on average, 80% of the time.
In other words, for every four bets they placed, three were losers.
But here is the secret to what we are doing.
We are putting ourselves on the other side of the table.
By that I mean, we are taking the bet instead of laying it down.
Which means statistically speaking, we get what the gamblers lose... just like a casino.
Their 80% failure rate... becomes your 80% win rate.
The 80% Win Rate Belongs to the House
Opposite sides
of the table.
One of the most important secrets I ever learned about investing is that—contrary to popular belief—taking more risk is a fool's game.
The true way to build wealth is to invest like a casino operator: betting against the people who are taking the big risks.
Why in the world would you ever put yourself on the gambler's side of the craps table when you can just as easily stand on the other side—the side of the casino owners scooping up all those bets the losers make?
Buying options is usually very risky... but selling options is an entirely different story.
For centuries, in-the-know bankers and the ultra-wealthy elite have capitalized on this secret.
When Wall Street insiders try to explain this mechanism to the public, they usually drown you in Greek mathematical letters, complex charts, and terrifying risk warnings.
That's intentional.
They want to make it sound like nuclear physics so you leave the cash to them.
I'm not going to do that.
I'm going to explain it exactly the way the wealth managers inside the rope understand it—which turns out to be exactly the way a beach house owner understands renting out their property.
Imagine you own a beautiful beach house.
You own it free and clear.
You're not using it most weeks of the year.
It just sits there, appreciating in value, collecting dust.
A vacationer approaches you.
He'd love to use the beach house for the next 30 days.
He makes you an offer:
"I'll pay you $10,000 in cash, right now, today, to rent your beach house for the next 30 days. And if I really love it, I want the option to buy it from you outright at $500,000—but only if I want to."
You agree on the spot.
Why wouldn't you?
You weren't using the house anyway.
$500,000 is exactly the price you'd be perfectly happy selling it for if it ever came to that.
And the $10,000 in cash, paid right now, is real money in your hand.
He hands you $10,000 in cash.
That cash drops directly into your account.
It's yours to keep, forever, no matter what happens next.
Now, over the next 30 days, exactly three things can happen.
If the housing market cools down and the buyer walks away, you keep the house. You keep his $10,000 cash. You're $10,000 richer, and nothing else changes.
If the market stays flat and the buyer never executes, you keep the house. You keep his $10,000.
And if the market explodes? You sell at the $500,000 price you already agreed to.
And you keep his $10,000 cash on top.
Three Outcomes. One Winner.

Buyer walks. You keep the house + the cash.
Buyer never executes. You keep the house + the cash.
You sell at $500,000 — and you keep the cash.
You don't lose. You can't lose. The math is structurally rigged in your favor—exactly the way Wall Street rigs it for themselves.
In real estate, this is a brilliant, standard contract.
Now here's what 99% of Americans don't realize.
The exact same rental contract is available on almost every single blue-chip stock in your retirement account.
Instead of a beach house, you own 100 shares of Johnson & Johnson.
Instead of a vacationer wanting to rent your house for 30 days, there is a huge market of speculators on Wall Street who want to rent the right to your shares of Johnson & Johnson for the next 30 days.
They want to lock up your shares for the contract period.
And they're willing to pay you upfront, in cash, for the privilege.
That cash is yours to keep.
When you punch a single line of code into your brokerage account, you're simply listing your shares for rent on the open market and collecting the cash from the speculator.
If you rent out 100 shares of Johnson & Johnson, the market pays you $287 in cash today.
It's deposited directly into your account.
It's yours to keep, no matter what happens next.
If the stock goes down, you keep the shares and you keep the $287 cash.
If the stock goes sideways, you keep the shares and you keep the $287 cash.
And what about the worst-case scenario—when the market moves against you?
You're forced to sell your shares at the agreed upon price and collect that money as well.
But the difference between the beach house owner who rents and the one who does not is profound.
The owner who rents has been collecting cash every month.
Their effective cost is thousands of dollars lower.
They have a cash cushion the non-renter does not.
And here is the most incredible part... the part most people completely miss.
When there is panic and uncertainty in the world... when the market drops... the cash payouts from renting your shares actually go UP.
Let me explain why.
As you well know, right now there's plenty of uncertainty in the world.
Inflation looms. Interest rates are volatile.
Geopolitical conflicts flare up.
The financial news cycle is designed to keep you terrified.
These sound like frightening developments.
But for our purposes, they're not bad at all. They're actually fantastic.
Here's why:
The more uncertainty there is in the world, the more amateur investors and frantic speculators want to buy options to gamble or protect themselves.
And the more people want to buy options, the higher their prices rise.
Basic supply and demand.
For buyers of options, that's terrible. That means they have to pay more for that right.
But for sellers (that's us!), it means you have the opportunity to collect MORE income upfront.
Because we are acting as the casino, when the speculators panic, we collect bigger checks.
The Panic Payout
To prove this, my team looked at one of the most terrifying weeks in recent market history.
In April 2025, the global markets panicked over sweeping tariff fears.
The financial press was screaming that a collapse was imminent.
Supply-chain companies bled.
Retail investors were panic-selling their portfolios to go into cash.
If you were relying on a standard "buy and hold" strategy, you were losing sleep.
But inside the velvet rope, the fear in the market meant speculators were paying massive upfront cash to rent stocks.
We checked the data on a standard 10-stock blue-chip portfolio that month. If you simply rented out your shares while the rest of the world panicked...
Johnson & Johnson distributed a $375 payout.
Google delivered $620 in cash.
McDonald's dropped a $625 check.
Apple triggered an $850 distribution.
Microsoft unleashed $1,360 in cash.
And Meta dropped an astonishing $3,825 distribution.
In a single 30-day window, while the financial media was predicting a catastrophic collapse, renting out that 10-stock portfolio triggered $16,565 in cash distributions.
The Panic Payout — $16,565 in 30 Days
Cash collected on a 10-stock blue-chip portfolio while the financial press predicted collapse.
The money was deposited directly into the accounts of the investors operating the machine. They kept the cash, and they kept their blue-chip shares.
Do you see why the institutional insiders and professional traders have kept this strategy such a closely held secret over the years?
Hundreds... thousands... even tens of thousands of dollars at a time—several times a year, year in and year out.
All money that reckless investors gamble away on options in hopes of beating the system and landing that big score.
And it isn't just macro panic that triggers these payouts.
Every single stock on the market goes through one guaranteed window of concentrated uncertainty four times a year: its quarterly earnings report.
In the days leading up to an earnings report, amateur speculators flood the market trying to bet on which direction the stock will jump. They drive the cash payouts on rental contracts up by 150% to 200% — sometimes more.
During a normal month, renting out a defensive blue-chip like Johnson & Johnson might pay you $215. But right before a major Nvidia earnings report, renting out 100 shares of Nvidia recently triggered a cash distribution of over $1,020 — for the exact same 30-day contract.
4.7× the cash — days before earnings
Every quarter. Every earnings season. Every single one of the blue-chip stocks in your retirement account goes through one of these windows.
Now, you might be asking: "What happens if the stock skyrockets? What if the beach house explodes in value?"
This is my favorite part of the experiment.
Because the worst-case scenario is actually your best-case scenario.
In May 2024, Nvidia was soaring ahead of an earnings report. Speculators were frantic.
If you held 100 shares of Nvidia and rented them out using our protocol, the market paid you $720 in upfront cash.
The stock skyrocketed. The speculator executed their right to "buy" your beach house at the agreed-upon price.
What happened?
You were forced to sell your shares at a massive profit. You locked in a $750 capital gain.
AND you kept the $720 in upfront cash!
You walked away with $1,470 in 30 days on a small $9,250 position.
Or look at Tesla in November 2024 during the election rally.
Renting out 100 shares put $3,105 in upfront cash in your account. The stock took off. The shares were called away at the agreed price, netting you a $2,500 capital gain.
You walked away with $5,605 in cash and profits in a single month.
That is $5,605 in a single 30-day window. On the same blue-chip stock the average retiree already owns. Not from selling. Not from waiting. From renting.
When the Worst Case Is the Best Case
When the market crashes, you collect massive rent.
When the market goes sideways, you collect massive rent.
When the market skyrockets, you capture the capital gains and you keep the rent.
You are the casino.
But if you want to see the true power of extracting cash by renting shares—what it does not just during raging bull markets, but during the most terrifying financial crashes in human history—you can't just look at today's retail investors.
You have to look at the history of a quiet firm in Cincinnati.
The Cincinnati Fortress
Gateway Investment Advisers was founded in December 1977 by a brilliant financial mind named Walter Sall.
Sall didn't care about beating the S&P 500 during speculative bubbles. He didn't want to play the Wall Street guessing game.
He cared about solid downside protection and bulletproof, consistent income streams.
So he built a firm entirely dedicated to the strategy of renting blue-chip stocks.
For the first 11 years of Gateway's existence, they accepted absolutely zero retail clients. It was an institutional-only fortress. If you weren't a pension fund or a massive university endowment, you could not get in.
And then, in October 1987, the ultimate test arrived.
Black Monday.
The stock market suffered the most violent single-day crash in financial history. The market plunged a terrifying 23%. Financial professionals were weeping on the floor of the exchange.
But inside Gateway, the cash machine just kept running.
Because of the unique structure of this renting machine—because they were acting as the casino, collecting upfront cash from terrified speculators—Gateway clients suffered only an 8% drawdown while the rest of the world was bleeding out 23%.
Gateway lost a third of what the market lost
Gateway didn't just survive the crash. They proved the architecture of the machine was bulletproof.
In January 1988, having proven the model during the worst financial disaster of the century, Gateway launched a mutual fund.
But even then, they kept the velvet rope up.
You cannot log into your standard retail account today and buy their primary retail fund directly. It is "advisor-sold only," meaning you have to pay a financial middleman to access it.
And their premier institutional share class—the one held by the massive endowments and family offices—requires a $100,000 minimum investment just to open the door.
Look at their track record over the long haul.
Gateway has posted positive calendar-year returns in 42 out of their 48 years of operation.
During that exact same 48-year span, the S&P 500 suffered roughly 13 negative, wealth-destroying years.
Across more than three decades of data—through Black Monday, the dot-com collapse, the Great Recession, and every correction in between—the mechanism outperformed in three out of four market environments.
Gateway hits 87.5% · S&P 500 hits 72.9%
This is not an opinion.
This is more than three decades of audited, institutional-grade data.
When you see everyday retirees extracting this kind of cash, and 48-year-old institutions protecting wealth through historic crashes... it forces you to ask a very uncomfortable question.
Why hasn't your broker ever told you about this?
The Two Sets of Rules
The answer is buried in the federal regulatory code.
When I was operating on the institutional side of the street, I learned the compliance rules backward and forward.
I was the analyst CNBC put on air in March of 2009 to call the market bottom—three days after the March 9 low.
I was the analyst who warned clients to position defensively in February of 2020 before the COVID crash erased a third of household retirement savings.
I built a career on seeing what was about to happen on the institutional side before it became visible on the retail side.
And I learned exactly how the system is rigged against the retail investor.
Decades ago, federal regulators wrote a specific, aggressive set of rules designed to restrict how financial professionals can talk to the public about certain market mechanisms.
On paper, the rules were supposedly written to "protect" everyday Americans from complex trades.
In reality, they created an impenetrable wall for the financially privileged.
By law, federal rules legally restrict retail-facing financial media and mass-market brokers from explaining this category of rental contracts in plain English.
A standard broker cannot simply call you on the phone and say, "Hey, list your Apple shares for rent and collect $296 today."
If they do, they violate federal compliance rules. They lose their license. The firm gets heavily fined.
So the insiders keep the secret, and they keep the cash.
But here is the most infuriating part.
While the government quietly prepares to slash your Social Security benefits by 23% to keep the system afloat, the political elite in Washington are not tightening their belts.
They are getting richer than ever before.
And they are doing it by standing on the right side of the velvet rope, using the exact same wealth mechanisms you have been legally restricted from hearing about.
I read the public disclosure forms. I look at the congressional trading logs.
Take Representative Josh Gottheimer of New Jersey.
He sits on the House Intelligence Committee and the House Financial Services Committee. Through those seats, he has access to information about the U.S. economy ordinary Americans will never see.
Public records show his family has rented out blue-chip shares in blocks worth more than $40 million in a single disclosure period.
What stocks was he renting?
Microsoft. Apple. The exact household-name corporations sitting in your retirement account right now.
Gottheimer is not an outlier. He is one of the most active practitioners of this strategy in the United States Congress.
In fact, recently, independent researchers tracked 105 different members of Congress who traded a combined $290 million in the stock market.
Congress's Own Rental Portfolio
The exact household-name blue chips already sitting in your retirement account — Microsoft, Apple, and more.
While the Federal Reserve was battling inflation, and while the Congressional Budget Office was quietly calculating the upcoming cuts to your Social Security... the political elite openly rented out their portfolios.
They are using the very financial transactions their own federal regulations make it almost impossible for your retail broker to explain to you.
Congress votes for the legislation that legally restricts your broker from explaining how this works. Then, they turn around and rent out the same blue-chip stocks sitting in your IRA.
They wrote the fence. They stand on the other side of it. And every thirty days, they reach across and collect the cash.
And the political class isn't the only group flooding into this strategy.
Six years ago, the total institutional capital deployed into this exact protocol was about $1 billion.
Today, it is over $200 billion.
That is a 200-fold increase in six years.
In July of 2025 alone, institutional capital flowed into this strategy at a record-breaking pace—$7.5 billion in a single month.
The largest single-month inflow ever recorded.
Every major Wall Street player is racing to position their wealthiest clients into this mechanism before the window closes.
From $1B to $200B+ in 6 years
Why the urgency?
Because the federal actuarial models project the Social Security trust fund will hit insolvency in 2033—triggering automatic 23% benefit cuts for every American collecting Social Security. Wall Street's quants are running their own models. They know retirees will need cash income that isn't dependent on a government check.
So the institutional money is flooding in early. Locking in positions. Renting out shares before the average American figures out what's happening.
$200 billion. 200 times bigger than six years ago. And accelerating.
That is not a fad. That is not a niche. That is the largest quiet capital migration in modern Wall Street history.
And every dollar of it is being extracted from the same boring blue-chip stocks sitting in your retirement account right now.
But as our three case studies proved, you do not need to be a Washington insider or a JPMorgan private client to access this.
Because the blue-chip stocks required to operate this system are likely sitting in your retirement account right now.
And we wanted to make absolutely sure this system was flawless before we released it to the public.
So my team and I ran a live mock portfolio. We didn't just backtest. We verified it right now, in the current market.
On April 17, 2026, we pulled the live payouts available on standard blue chips.
We verified that 100 shares of McDonald's paid $282.
We verified that 100 shares of Johnson & Johnson paid $287.
We verified that 100 shares of Apple paid $296.
And we verified that 100 shares of Microsoft paid $860.
These aren't historical anomalies. This is cash that is available in the market right now.
$1,725 available — in a single 30-day window
These payouts were quoted in the live market on the date we ran the verification.
The Compounding Engine
To really show you the power of "renting" your shares... my team and I took it a step further.
We narrowed the entire market down to exactly 10 stocks.
We call it The Ultimate Income Portfolio.
And when you discover how to "rent" these 10 specific stocks, the compounding math will completely change the way you view your retirement.
Let me show you what I mean.
Let's look at a standard, conservative slice of this portfolio holding just 100 shares each of five of America's most recognizable companies.
The exact companies you probably already hold.
If you held those shares the "normal" way, relying entirely on their standard corporate dividends to generate your income, your math is grim.
Across all five of those massive companies, your regular dividends would generate approximately $1,869 for the entire year.
Now, let's step inside the velvet rope.
Let's act as the casino and rent out those exact same stocks.
Renting out 100 shares of McDonald's had the potential to hand you a $282 payout.
Johnson & Johnson delivered a $287 payout.
Apple—the number one most widely held stock in America—collected $296.
Microsoft dropped an astonishing $860 in a single month.
And Meta unleashed an incredible $2,475.
$282... $287... $296... $860... $2,475.
On a simple five-stock portfolio, renting out those shares delivered $4,200 in upfront cash in a single 30-day window.
That's $50,400 a year. More than double the average Security benefit.
From five blue-chip stocks you probably already own.
$4,200 a month — $50,400 projected per year
Five blue chips you probably already own — quoted in a single 30-day window.
That is your property tax check. That is two months of car payments. That is the trip to Italy you told your wife you would take "someday."
And the most important part? Not a single share of McDonald's, Johnson & Johnson, Apple, Microsoft, or Meta was sold to generate that $4,200. You kept your shares. You collected the normal corporate dividends. And you received the cash on top of it all.
And remember, those five stocks are only half of the system.
The Ultimate Income Portfolio holds five more stocks I have not yet named on this page.
I'll show you how to access the entire portfolio shortly.
But here's what's incredible: if you deploy a standard, balanced portfolio across all 10 of these stocks, renting your shares routinely produces a blended annualized yield of roughly 25%.
That's 5.5 times higher than the best CD rate on the market.
6 times higher than a 10-year Treasury.
And an astonishing 22 times higher than the average S&P 500 corporate dividend.
A 25% blended yield — dimensionalized
But I want you to look at what happens when you let this math compound.
My team ran the backtest data on what happens if you take that $4,200 you collected in month one, and instead of spending it, you reinvest it into a few more stocks to rent out.
In month two, your monthly distribution grows to $4,325.
In month three, it hits $4,480.
By year two, the machine is churning out $6,400 a month.
That is more than triple the average Social Security check—except this one comes from your own stocks, not from a trust fund the government's own actuaries admit is going insolvent.
By year five, you are collecting $8,500 in cash every 30 days.
That is $102,000 a year.
A six-figure salary.
Except you earn it in 30 seconds a month instead of 40 hours a week.
From $4,200/month to $8,500/month
Assumes rental cash is reinvested into additional rentable positions each month.
Your Social Security check hits the account on the 3rd.
Your regular dividends trickle in between.
Your rental cash hits on the 15th.
Three streams of capital.
Of course, consistently compounding your money without taking a single dollar off the table is a discipline few possess... and there are always curveballs in the market.
It goes without saying the past does not guarantee the future.
But as I showed you with Gateway... we're not talking about a flash-in-the-pan.
This is decades of consistent results.
Which brings me to an important point...
The Free Ticker I Promised You
Before I show you exactly how to access the full system, I owe you something.
I promised earlier that I would give you a free ticker symbol—a public version of this same renting protocol you can buy today, no membership required, no advisor needed.
Here it is.
It is called JEPI—JPMorgan Equity Premium Income.
A regulated income ETF — buyable in 60 seconds
You can buy it in your brokerage account in 60 seconds.
No minimum. No advisor required.
JPMorgan launched it in May of 2020 because the institutional demand for renting stocks had grown so massive that they had to package a public version.
Ordinary Americans who could not afford their multi-million-dollar private wealth minimums were demanding access.
Here is what JEPI does.
It owns a basket of large-cap American blue-chip stocks—many of the same boring names we have been discussing on this page.
And every month, it rents those shares out and collects upfront cash.
That cash is then paid directly to JEPI shareholders as monthly distributions.
The fund currently pays approximately 8.5% per year.
That is nearly 800% more than the average S&P 500 dividend stock.
That is more than DOUBLE what the best 1-year CD currently pays.
That is roughly four times the national average certificate of deposit.
And the fund has grown into a $44 billion juggernaut—making it nearly 90 times larger than the average actively managed ETF on the market today.
Most Americans have never heard of it.
Now you have. That is the free gift I promised.
For most folks, JEPI is a genuinely good thing to own.
But here is why it is only HALF the prize.
JEPI is a publicly registered ETF. By federal law, it is required to follow strict diversification mandates. Daily liquidity rules. Conservative risk caps. The fund's hands are tied.
It cannot rent its highest-yielding shares aggressively.
It cannot concentrate on the absolute highest-paying targets.
It cannot tactically deploy into the earnings-month opportunities or panic-payout windows we documented earlier.
A $44 billion regulated ETF runs a defensive, watered-down version of the strategy.
When YOU run this on your own portfolio—when you have full control over which 10 specific blue-chip stocks you rent, when you rent them, and what cash terms you accept—the documented blended yield runs 18% to 25% per year on the same boring blue-chip stocks.
On a standard $383,000 retirement account, JEPI's 8.5% yield distributes approximately $32,500 a year.
Real money. Far better than the 1.07% S&P average.
But on the same $383,000 portfolio, the proprietary system our case studies executed produces approximately $95,750 a year.
Almost three times the cash.
The only difference is who is running the protocol—JPMorgan, inside their regulated wrapper, or you, with full control over every parameter.
Buy JEPI today and you will collect roughly $2,700 a month.
Or, you can run the unregulated, full-power version yourself—and collect roughly $7,980 a month from the same blue chips.
Remember: $7,980 a month is $95,750 a year. That is more than nearly TWO TIMES the average Social Security check, and almost three times what JEPI alone would pay you. From the same retirement portfolio you already own.
Two versions of the strategy — two very different paychecks
That is the difference. And here is exactly how to build it.
Portfolio Payouts
See, everything I've shown you has been to help you understand the sheer power of this "renting" system.
But, that's only half the story.
I know for a lot of investors, knowing what stocks are best to rent... when it's best to rent them... and guidance on some of the hurdles can be a roadblock.
I don't want anything to get in the way of you using this system.
So I created an entirely new service for my firm to offer.
It's called Portfolio Payouts.
And I want to give you 12 months of access to it, today, as part of a Founding Member's invitation.
When you accept my invitation to join Portfolio Payouts today, here is exactly what you'll receive:
The Portfolio Payouts Dashboard
Think of this as your personal income command center...
Built with advanced AI tools and algorithms to give Main Street investors one of the most accurate and practical tools available.
The moment you log in, you get a live readout of the best opportunities available right now — ranked, scored, and ready to go.
Pick any stock on the list, and the dashboard shows you exactly what you'd pocket today.
It shows you the odds that you'll collect that money and keep your shares at the end of the 30-day window.
And it updates in real time, so you're always looking at what the market is actually doing — not yesterday's data.
No spreadsheets. No guesswork. No staring at an options chain trying to figure out which strike makes sense.
You just log in, see your best options for the day, and decide if you want to act. The whole thing takes about five minutes.
Look here and you can see how, today, you could have logged in and grabbed up to $2,195 on Microsoft.
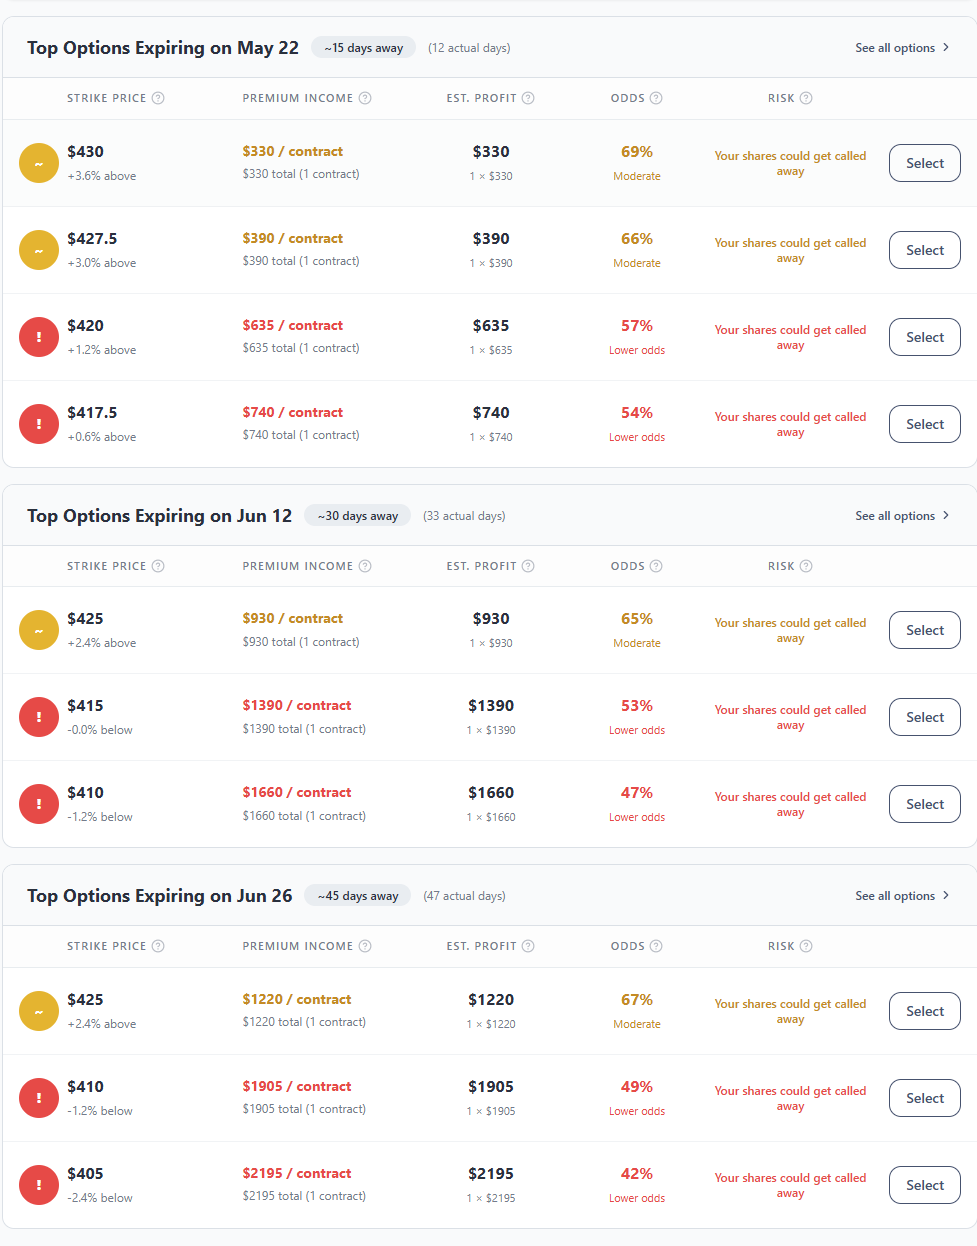
This is a proprietary technology we have built specifically for Portfolio Payouts.
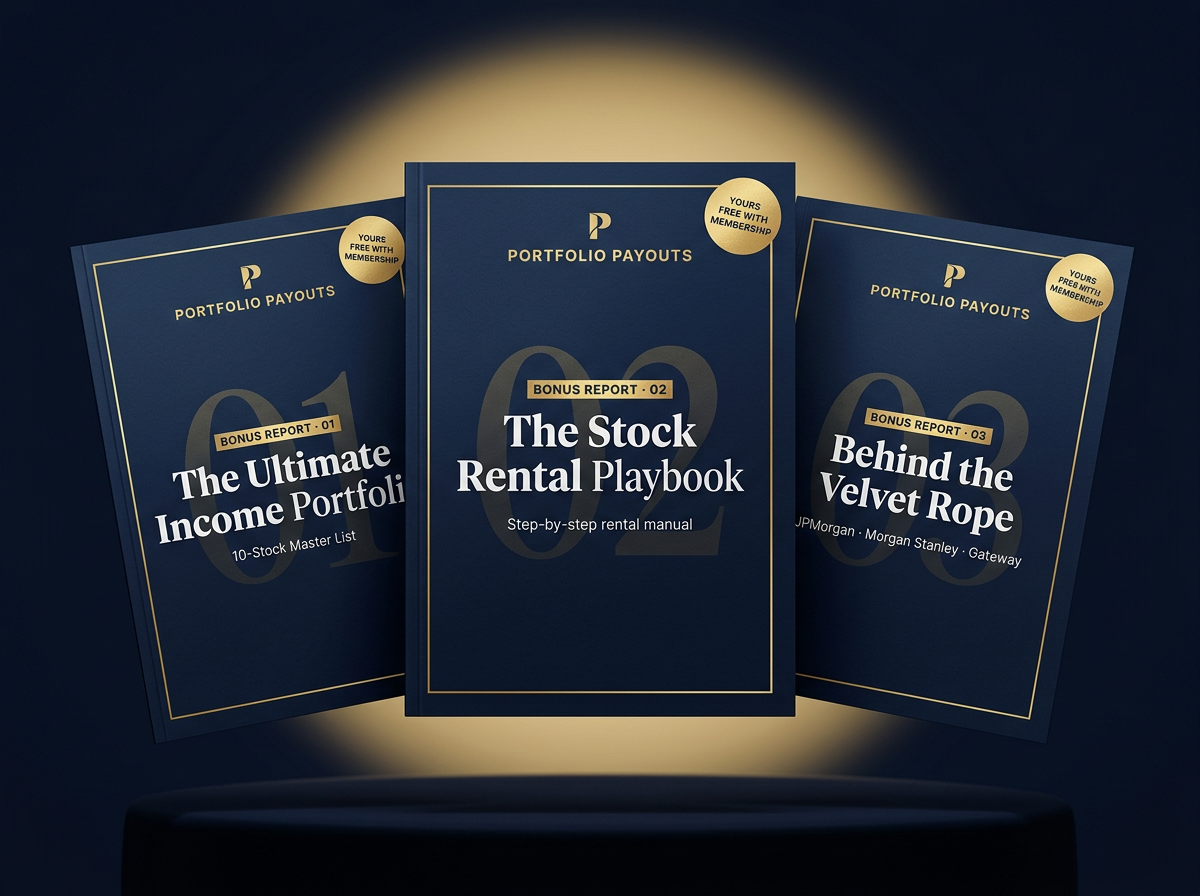
Now, because we are strictly committed to making sure you understand this system inside and out before you place a single trade, I am also going to send you three critical bonuses.
BONUS REPORT #1. The Ultimate Income Portfolio (The 10-Stock Master List)
My team and I narrowed the entire market down to exactly 10 stocks that produce the highest, safest options "rental" distributions in the world.
I gave you five of them today for free (Apple, JNJ, McDonald's, Microsoft, and Meta).
You can log into your brokerage account tomorrow morning and verify the math yourself.
But those five are only half the system.
Inside the Ultimate Income Portfolio, you will get the names, the ticker symbols, and the exact parameters for the five remaining targets.
When you scale this protocol across these 10 specific stocks, the numbers become staggering.
Last month, Meta paid $24.75 per share in rental cash.
If you own 100 shares, renting them out triggers a distribution of $2,475.
On 200 shares, you receive $4,950.
On 500 shares, you trigger $12,375.
On 1,000 shares, that is a jaw-dropping $24,750 payout.
In a single 30-day window.
$24.75 per share — scaled by position size
BONUS REPORT #2: The Stock Rental Playbook
If you have never executed a trade outside of buying a basic mutual fund, do not worry.
This is your complete, step-by-step master manual.
I have stripped out all the Wall Street jargon.
I show you exactly what buttons to click, what screens to look at, and how to trigger your first cash payout in under five minutes.
By the time you finish reading this, you will know more about generating cash than 99% of retail brokers.
BONUS REPORT #3: Behind the Velvet Rope
This is the complete, documented history of the institutional giants running this exact mechanism.
It breaks down exactly how JPMorgan, Morgan Stanley, and Gateway operate their funds. I give you this report so that when a standard broker tells you this strategy is "too complex," you can hand them the math and show them exactly what the top 10 US banks are already doing.
All three of these reports are yours to keep, absolutely free, the moment you join.
Three Bonus Reports — Yours Free
The Ultimate Income Portfolio · The Stock Rental Playbook · Behind the Velvet Rope
The Founding Member Invitation
How much does a one-year membership to Portfolio Payouts cost?
As you probably guessed, it's not cheap. For some folks, it will be too expensive.
Let's look at the financial reality.
If you want Morgan Stanley's Parametric division to run this strategy for you, you must hand them a minimum of $1,000,000 just to open the door, plus their management fees.
If you go to the Cincinnati firm Gateway, you need a $100,000 minimum investment just for their institutional class.
If you go to a standard wealth manager, they will charge you 1% to 2% of your total portfolio every single year, bleeding your principal dry—and they still won't tell you about this mechanism because federal red tape restricts them.
What it costs to access this strategy
When my publisher and I sat down to price Portfolio Payouts, we knew we had a product that was structurally unmatched in the retail market.
We invested thousands of man-hours into the 8-year backtest alone.
We are sharing real liquidity opportunities in a market that relies on a specific balance of buyers and sellers.
For that reason, the standard, public price for a one-year subscription to Portfolio Payouts is $1,997.
And frankly, at $1,997, it is an absolute bargain.
But today is the official launch of this service.
We want to build a bedrock group of serious, dedicated Americans who will use this system to protect their retirements from the coming Peak 65 cuts.
So, I am authorizing a strict, limited release.
I am opening exactly 500 "Founding Member" seats today.
If you claim one of these 500 seats, you will not pay $1,997.
You will receive a full year of Portfolio Payouts, the Ultimate Income Portfolio, the monthly briefings, the proprietary dashboard, and all three bonus reports for just $997.
Strictly limited to the first 500 respondents
I want you to put that $997 into perspective.
We verified that renting out 100 shares of Apple recently collected $296.
If you simply rented out that one, single, conservative blue-chip stock... the cash you extract pays for almost a third of this entire research service in a single month.
Renting out your shares of Microsoft ($860) almost covers the entire year in a single 30-day window.
And renting out 100 shares of Meta ($2,475) pays the service more than twice over—the very second you list those shares for rent.
The cost of this research is trivial compared to the cash it is designed to help you extract.
One rental pays for Portfolio Payouts
And I am going to make this decision absolutely effortless for you by taking all the risk off your shoulders.
My 30-Day, 100% Money-Back Guarantee
I don't want you to take my word for any of this. I want you to prove it to yourself.
When you click the button below and secure your Founding Member seat for $997, you are not making a final commitment. You are simply taking the system for a test drive.
You have a full 30 days to review everything.
Download The Stock Rental Playbook. Review the Ultimate Income Portfolio. Read the reports.
Go to the member's only, 24/7 dashboard and check everything out.
Log into your standard brokerage account and "paper-trade" the contracts without risking a dime.
Watch the live market.
See the exact cash payouts being offered in real time.
If, at any point in your first 30 days, you are not completely convinced that this is the safest, most lucrative, and most powerful income strategy you have ever seen...
If you don't find the instructions incredibly simple to execute...
Or if you just decide this strategy isn't right for you, for ANY reason whatsoever...
Simply contact my customer service team based right here in Delray Beach, Florida. We will issue a prompt, 100% refund of your $997 subscription fee. No questions asked. No bureaucratic hoops to jump through.
And you keep all three bonus reports, the Ultimate Income Portfolio, and every briefing you've received, completely free of charge, as my way of saying thank you for participating in our experiment.
30-day, 100% money-back guarantee

- Full $997 refundEvery dollar back
- No questions askedOne email is enough
- Keep all 3 bonus reportsYours to retain
- US customer serviceDelray Beach, FL
The Vault is Open
You are standing at a critical crossroads.
The Peak 65 wave is here. 11,400 Americans are retiring every single day, stepping into a system that is broken.
The 4% rule is dead. Social Security is marching toward a legally mandated 23% cut.
You can choose to do what the crowd does.
You can sit passively, clip your 1.07% dividends, watch inflation eat your purchasing power, and pray the market doesn't crash.
Or, you can step inside the velvet rope.
You can act like the casino.
You can join the institutional giants, the retired school administrators, the former history teachers, and the political elite who are extracting thousands of dollars in upfront cash from the markets every single month—regardless of whether stocks go up, down, or sideways.
The distributions are running. The cash is waiting.
If that cash doesn't hit your account... it is hitting a hedge fund's account. There is no third option.
But I am strictly limiting this Founding Member offer to the first 500 respondents today. Once those seats are claimed, the price reverts to the standard $1,997.
Do not let another 30 days pass while Wall Street collects the cash that rightfully belongs to you.
Click the secure button below to claim your Founding Member seat, access the Ultimate Income Portfolio, and start extracting cash today.
Sincerely,
Dylan Jovine
Founder, Portfolio Payouts & Behind the Markets
May 2026
P.S. The secret to extracting $282 from McDonald's, $287 from Johnson & Johnson, $296 from Apple, $860 from Microsoft, and $2,475 from a single 100-share position in Meta comes down to a simple rental mechanism Wall Street has kept to itself for more than 50 years.
Not only have I shown you exactly what they're doing inside the velvet rope...
I have also given you the name of a free public ticker where the top wealth managers in America will execute a watered-down version of this strategy for you automatically — paying monthly distributions of approximately 8.5% per year. Nearly 800% more than the average S&P 500 dividend stock. More than DOUBLE what the best 1-year CD currently pays.
But that ticker is only HALF the prize.
The full system — the one we built and tested over 8 years across 7,000 individual transactions — is the only way to extract the $4,200 monthly cash drops we documented for you above.
What one 30-day window pays — five blue chips
Don't let another 30 days pass while Wall Street collects the cash that rightfully belongs to you.